Best Time to Sell Your Tempe Royal Palms Home in 2026
February 19, 2026
February 19, 2026
Is there a right month to sell in Tempe Royal Palms? In a small subdivision, timing can make a real difference in how fast you sell and how much you net. You want clear, local guidance that fits your home, your calendar, and today’s buyers. This guide shows you how seasonality, interest rates, and inventory shape your results, plus the exact data to review before you list. Let’s dive in.
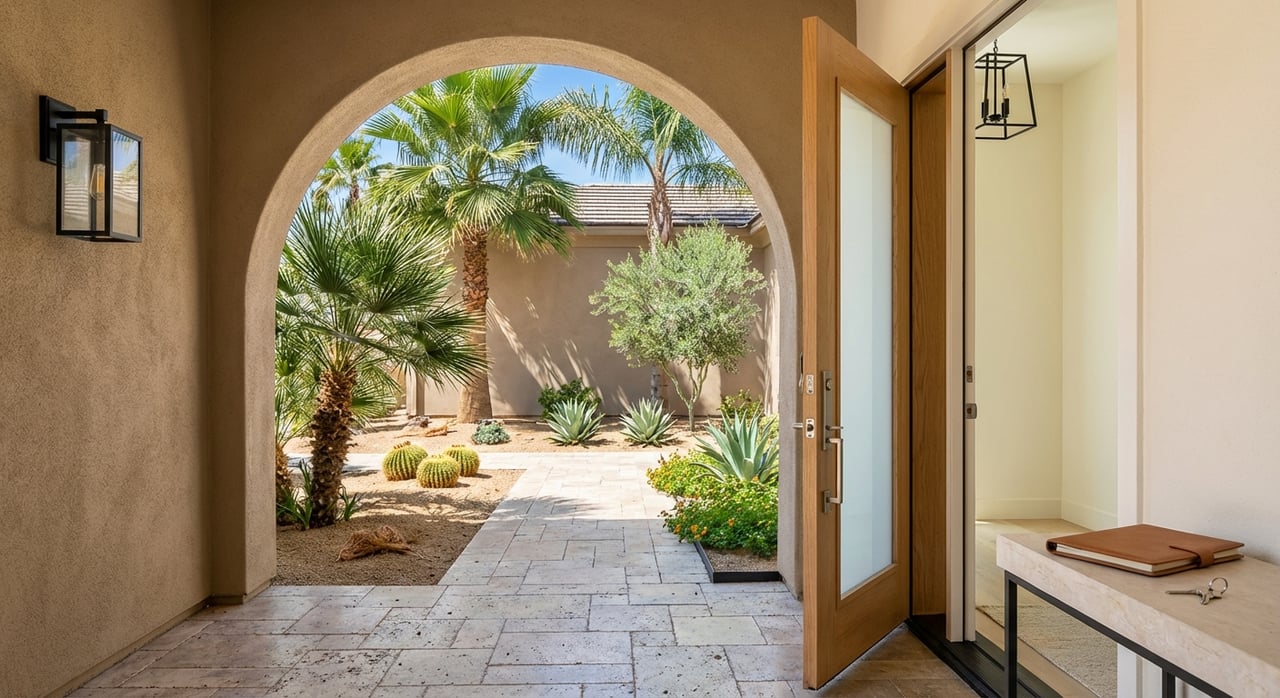
Tempe Royal Palms is an established South Tempe subdivision near McClintock Drive and Elliot Road. Most homes were built in the mid-1970s through the 1980s, with a mix of single-family and patio-style homes. Some phases include community amenities and modest HOA fees, and the neighborhood offers convenient access to Loop routes and the ASU Research Park.
Recent neighborhood resale activity suggests a narrow price band. In late 2025 through early 2026, several sales clustered around the high-$400Ks to about $516K, with the neighborhood median near $500K in January 2026. Because Tempe Royal Palms sees few closings each month, single sales can shift the “median” quickly. Use the most recent within-subdivision comps when you set price.
Across the Phoenix area, buyer activity tends to swell from late winter through late spring. National research points to a late-spring window for the best price outcomes, while early spring often delivers faster contracts. In Tempe, you’ll typically see strong activity from March through May, with some years showing a secondary fall window.
Heat matters. Summer showings can slow due to high temperatures, which can affect open house traffic. If you want to appeal to buyers planning around job moves or the school year, spring and early summer listing dates usually align better with their timelines. If you must list outside spring, precise pricing and standout presentation become even more important.
Tempe’s buyer pool skews young and dynamic, shaped by a large university presence, growing employment, and a steady mix of renters and owners. City data shows a relatively young median age and diverse housing patterns, which supports ongoing demand for well-located homes of different sizes. For quick city-level context, explore Tempe’s demographics on the Census Reporter profile for the city of Tempe.
In a neighborhood like Tempe Royal Palms, many buyers are local owner-occupiers and area professionals. ASU and related employers add steady demand from staff and graduate students who prefer a short commute. You may also see some investors if a home shows clear rental appeal. Because the subdivision is small, one or two motivated buyers at the same time can influence how competitive your sale becomes.
Two market levers matter most when you choose your list date: mortgage rates and months of supply.
Mortgage rates. As of the Feb 12, 2026 Freddie Mac survey, the 30-year fixed averaged about 6.09 percent, with the 15-year around 5.44 percent. When rates fall, buyer purchasing power improves and offers can pick up. When rates rise, buyers get more price sensitive. You can track the weekly trend on Freddie Mac’s Primary Mortgage Market Survey. For a near-term demand read, the Mortgage Bankers Association’s weekly purchase application report shows how buyers respond to rate moves week by week.
Months of supply. City reporting for Tempe in January 2026 showed roughly 2.1 months of supply. That is a seller-leaning but near-balanced level. In a small subdivision like Tempe Royal Palms, micro-conditions can swing quickly based on just a few new listings. If you see multiple similar homes hit the market at once, expect more negotiation pressure. If inventory stays thin, a well-prepared listing can stand out and attract stronger terms.
Use these practical windows to match your goal. Confirm the final dates with a fresh MLS snapshot and the latest rate trend before you go live.
Ask for a printed, neighborhood-level packet and review each item together.
If your goal is top dollar, aim to be market-ready by late April to catch May’s buyer surge. If speed matters more, target mid-March to early April. Outside spring, success comes from precise pricing, standout presentation, and close tracking of rates and supply. If you want a clear, local plan tailored to your home, schedule a short comp and timing review with our team at Birk.
References for data and context:
Stay up to date on the latest real estate trends.
Real Estate
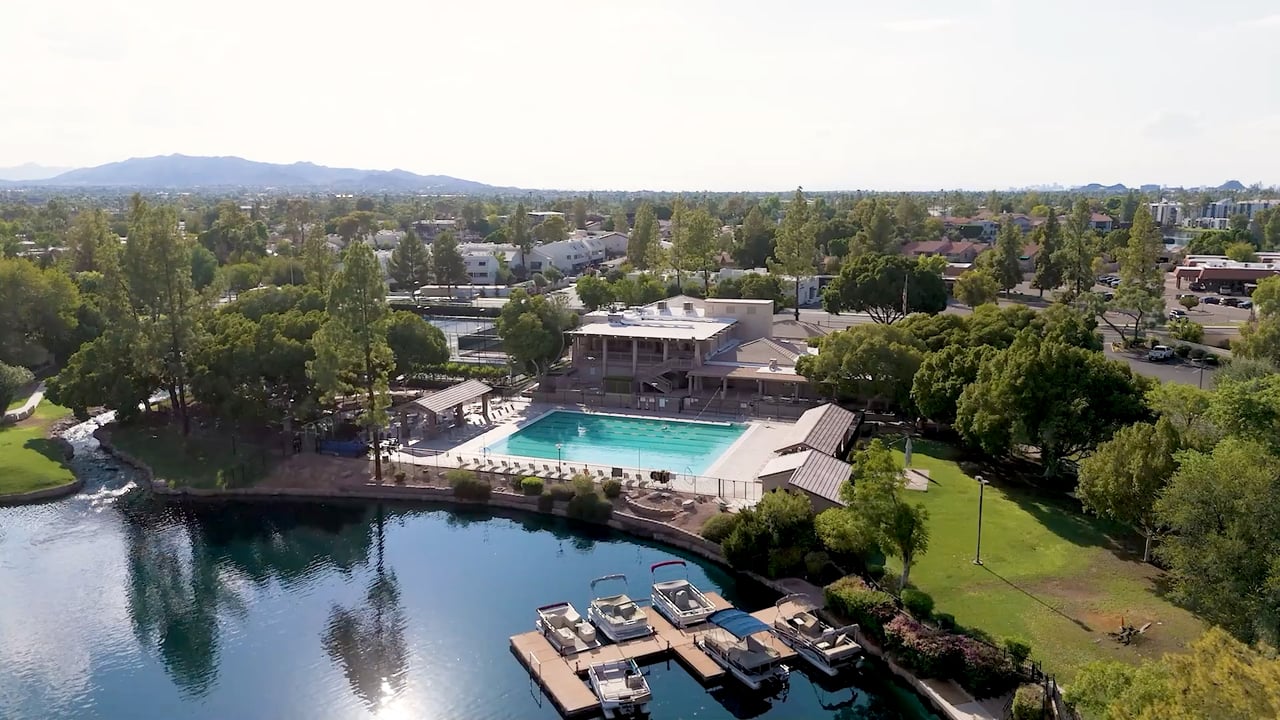
What's Happening in The Lakes?
Real Estate
January Recap in The Lakes
Get assistance in determining current property value, crafting a competitive offer, writing and negotiating a contract, and much more. Contact us today.